March Madness 2018
March Madness 2018 Kaggle Competition
Kaggle is a pretty popular website for machine learning competitions and playgrounds that are familiar to most people in the data science world. So among the many contests they have available, one in particular piqued my interest a few weeks ago which was this year’s March Madness bracket competition! Personally, I’m an NBA fan but the excitement around NCAA Division I basketball has always interested me.
It’s surprisingly easy to get started with a competition in Kaggle, and there was a good starter kernel provided by someone from Google to help people get started. I used that in addition to reading some of the discussion threads.
My code for both the men’s and women’s competition is available on my GitHub. For my relatively simple models, I was able to place 113th out of 934 for the men’s and 182nd out of 505 for the women’s. Not too shabby!
So what was the basic idea behind the model? For each team, we build a vector consisting of summary statistics of team’s performance over the season.
By using the data provided by Kaggle, we can build a vector that looks something like this:
return [numWins, avgPoints, avgPointsAllowed, avgFGM, avgOppFGM, avgFGA, avgOppFGA, avgFGM3, avgOppFGM3, avgFGA3, avgOppFGA3,
avgFTM, avgOppFTM, avgFTA, avgOppFTA, avgOR, avgOppOR, avgDR, avgOppDR, avgAst, avgOppAst, avgTO, avgOppTO, avgStl,
avgOppStl, avgBlk, avgOppBlk, avgPF, avgOppPF, tournamentSeed, sos, srs]
So basic basketball stats like points, offensive/defensive rebounds, assists, blocks are given in a team’s vector. We then need to compute the percentage chance that one team will defeat in another by pairing any two teams vectors together. We do this simply by subtracting one team’s vector from another for any particular matchup. I decided to use this method as it was chosen in Google’s example kernel but perhaps other methods such as averaging could be tested in the future.
Using feature importance methods in scikit-learn, I was able to determine that the number of wins in the season was the most predictive followed by advanced analytical scores of teams such as sos, srs, and sag. SOS is the Strength Of Schedule which is a metric designed for determining the strength of opponents a team has faced. SRS is the Simple Rating System which is a metric incorporating SOS and average point differential. SAG is a metric designed by Jeff Sagarin.

After testing a few classification models in sci-kit learn, I settled on the GradientBoostingClassifier as it provided the most accuracy on historical seasons in Stage 1 of the Kaggle competition. I combined it with GridSearchCV to search the space for the best number of estimators and depth of trees.
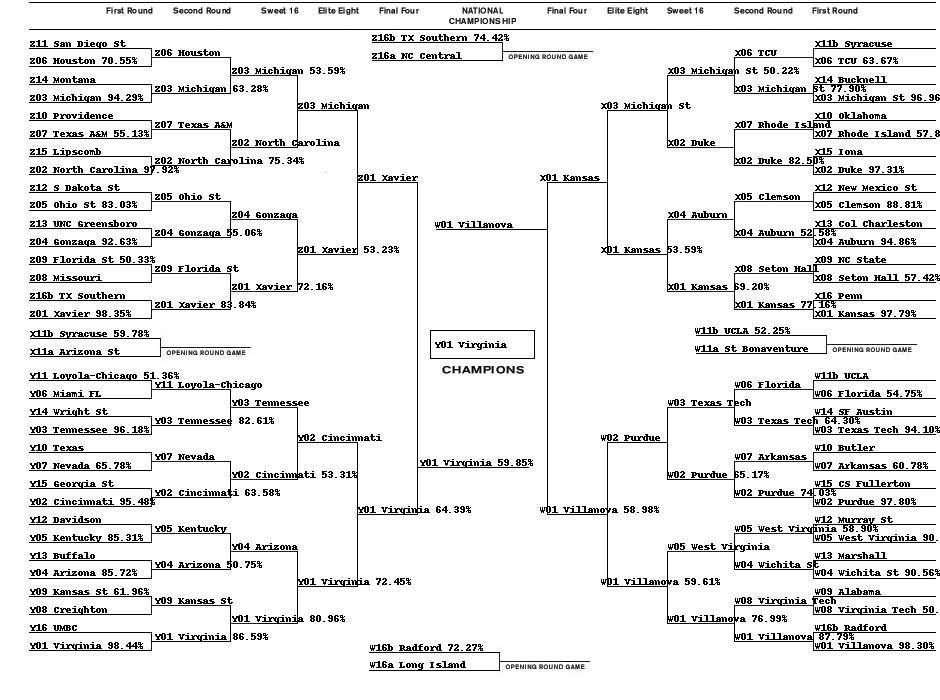
Below is the output predictions of my model! In this year’s actual tournament there turned out to be a bunch of upsets including the unprecedented event of a 16th seed upsetting the 1st seed with UMBC upsetting Virginia. Kinda funny how the model predicts them as the winner and they don’t even get out of the first round. Goes to show that in life and basketball there is a lot of variance that is difficult to account for.
After the competition was over the winner of the women’s competition had an interesting post on his solution (which was partially a fluke): Link
I’m definitely going to try an approach like this for next years contest to test the ability of xgboost!